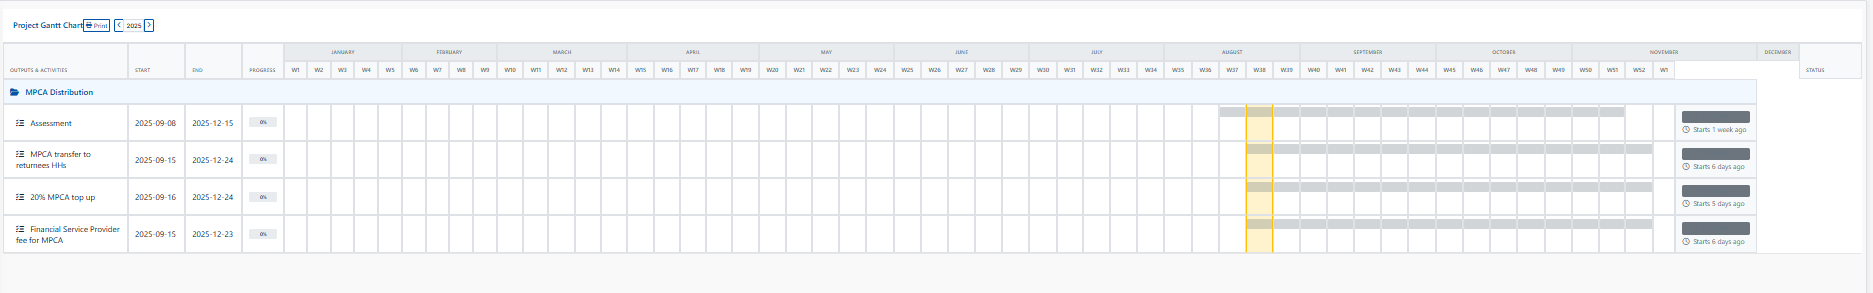
Gantt Chart
Interactive yearly Gantt view of project outputs and activities.
Header controls:
- Year navigation (Prev/Next)
- Current year indicator
Table layout:
- Columns: Output/Activity, Start, End, Progress, Weeks (W1..W52), Status
- Rows: Output headers, followed by activity rows
- Activity row shows a progress bar and weekly timeline bars, highlighting the current week.
Status coloring:
- Completed (green), In Progress (blue), Delayed (red), Pending (gray)
Notes:
- Access gated by "view Implementation Execution".
Screenshot: